AI-powered sentiment analysis, trading signals, and the technology behind smarter market decisions.
6 min read
AISentimentFinBERT
How AI-Powered Sentiment Analysis Transforms Reddit Stock Discussions into Trading Signals
The stock market has always been driven by human emotion—fear, greed, and everything in between. What if you could measure that emotion in real-time across thousands of discussions? That's exactly what StockHark does, combining cutting-edge artificial intelligence with social media data to give traders a competitive edge.
The Technology Behind the Insights
Every hour, StockHark automatically scans Reddit's most active investing communities, analyzing posts about over 4,200 stocks from NYSE, NASDAQ, and AMEX. We use FinBERT, a specialized AI model trained specifically on financial language, to understand whether discussions are bullish, bearish, or neutral.
Why FinBERT? Unlike generic sentiment tools, FinBERT recognizes financial jargon—it knows the difference between "short squeeze" excitement and genuine bearish concerns. It understands context like "beating earnings" versus "missing targets."
Beyond Raw AI Scores
Raw sentiment isn't enough. We apply sophisticated weighting algorithms that consider multiple critical factors:
Recency: Fresh posts matter more—a 24-hour-old post carries only 9% of the weight of a brand new discussion
Source Reliability: Posts from r/wallstreetbets are weighted differently than r/investing or r/stocks
Discussion Volume: One person screaming about a stock is noise; hundreds discussing it independently is a signal
User Credibility: Account age, karma, and posting history all factor into the final score
Data Quality & Anti-Manipulation
To ensure data integrity, we filter out duplicates using cryptographic hashing (SHA-256) and near-duplicate detection (SimHash with Hamming distance checks). This prevents spam, bots, and coordinated pump attempts from skewing our sentiment scores. Every mention is validated against our comprehensive stock symbol database, eliminating false positives from casual conversation.
The result? A confidence-weighted sentiment score between -1 (extremely bearish) and +1 (extremely bullish) that updates throughout the day. Traders can spot emerging trends before they hit mainstream news, identify unusual activity patterns, and make more informed decisions backed by real community sentiment.
S
StockHark TeamEngineering
5 min read
TradingSentiment
Why Reddit Stock Sentiment Matters More Than You Think
Traditional market analysis relies on corporate earnings, analyst ratings, and technical charts. But there's a massive blind spot: what actual investors are thinking and feeling right now. Reddit's investing communities—with millions of active traders sharing research, opinions, and real-time reactions—represent an untapped goldmine of sentiment data.
Early Warning Signals
When thousands of retail investors start discussing a stock, it often signals something important happening beneath the surface:
Breaking news that hasn't hit mainstream media yet
Insider knowledge spreading through trading communities
Sentiment shifts ahead of major price movements
Emerging trends before institutional investors react
The challenge is separating genuine signals from noise, hype, and manipulation. That's where AI makes the difference.
Context is Everything
StockHark's AI doesn't just count mentions—it understands context. When someone posts "I'm shorting TSLA because production numbers look weak," our FinBERT model recognizes this as bearish sentiment tied to fundamental concerns. When another user says "TSLA short squeeze incoming! 🚀🚀🚀," we identify this as speculative excitement with lower reliability.
Discovered Pattern: Stocks with sudden sentiment spikes often see corresponding price movements within 2-6 hours. Sustained positive sentiment across multiple subreddits correlates with stronger upward momentum than short-lived hype bursts.
Complementing Traditional Analysis
This isn't about replacing fundamental analysis or technical indicators—it's about adding a crucial missing piece. Social sentiment gives you real-time insight into market psychology, helping you understand not just what stocks are moving, but why traders care about them. In today's retail-driven markets, that information is increasingly valuable.
S
StockHark TeamResearch
7 min read
AIData PipelineDeep Dive
Inside StockHark's Sentiment Pipeline: From Raw Posts to Actionable Scores
Building a reliable sentiment analysis system is harder than it sounds. Social media is messy—sarcasm, emoji spam, bots, coordinated pump schemes, and thousands of irrelevant conversations that mention stock symbols coincidentally. How do you extract meaningful signals from that chaos?
Stage 1: Data Collection & Validation
Every hour, we scan posts from Reddit's top investing subreddits. Each post is checked against our database of 4,200+ ticker symbols from NYSE, NASDAQ, and AMEX. We use context-aware validation—mentioning "WORK" in "I work from home" doesn't count, but "Bullish on $WORK" does. Posts are timestamped with precise collection metadata for downstream weighting.
Stage 2: Duplicate & Bot Detection
Before analysis, we filter aggressively:
Exact duplicates caught via SHA-256 hashing
Near-duplicates identified using SimHash with Hamming distance comparison
Known bot patterns and suspicious posting frequency flagged
Low-karma accounts triggering additional scrutiny
This stage typically filters out 15-20% of raw mentions, ensuring only quality data proceeds to analysis.
Stage 3: AI Sentiment Scoring
FinBERT analyzes each cleaned post. Unlike general-purpose sentiment models, FinBERT was specifically trained on financial news and analyst reports, so it understands domain-specific language. It outputs three probabilities: positive, negative, and neutral. We convert these to a numerical score between -1 and +1.
Fallback System: For posts without enough financial context, we apply a rule-based fallback using finance-specific lexicons and phrase patterns to ensure no valuable data is lost.
Stage 4: Multi-Factor Weighting
Raw sentiment scores are adjusted based on several critical factors:
Time Decay: Exponential weighting (λ=0.1) means older posts carry significantly less weight
Source Reliability: Different subreddits weighted based on historical accuracy and spam levels
Volume Signals: More independent mentions increase confidence; lone mentions are downweighted
User Credibility: Account age, karma, and posting history influence final weights
Stage 5: Aggregation & Confidence Scoring
All weighted scores for a stock are aggregated into a final sentiment value with an accompanying confidence metric. High confidence means many recent, diverse, credible sources agree. Low confidence might indicate conflicting signals, old data, or limited discussion volume.
This two-number output (sentiment + confidence) helps traders understand both direction and reliability—crucial for making informed decisions.
S
StockHark TeamEngineering
5 min read
TradingGuide
How to Use Social Sentiment Data Without Getting Burned
Sentiment analysis is powerful, but it's not a crystal ball. We've observed traders making two common mistakes: treating sentiment as a standalone trading signal, or dismissing it entirely as "just Reddit noise." The truth is more nuanced.
Use Sentiment for Confirmation, Not Prediction
If you're already watching a stock based on fundamentals or technicals, sentiment can confirm your thesis:
Strong positive sentiment + good earnings = higher confidence in upward movement
Strong positive sentiment + weak fundamentals = be cautious, might be temporary hype
Best Practice: Sentiment works best when it aligns with other signals you trust. Use it as a supporting indicator, not the primary decision driver.
Pay Attention to Sudden Changes
Gradual sentiment shifts are informative but not urgent. Sudden spikes or crashes in sentiment, especially across multiple communities, demand immediate attention. These often precede news events, earnings surprises, or regulatory announcements. StockHark's time-based filtering (2h, 6h, 24h, 48h views) helps you spot these rapid changes in real-time.
Volume + Sentiment = Stronger Signal
One highly-upvoted post about a stock is interesting. Fifty independent posts from different users across multiple subreddits is a trend. StockHark's confidence score helps you distinguish between noise and genuine consensus:
Low-confidence bullish hype → approach with healthy skepticism
High-confidence + high volume → strongest signal strength
Diversify Your Information Sources
Don't rely solely on social sentiment. Combine it with earnings reports, SEC filings, technical analysis, and macro trends. Sentiment tells you what the crowd thinks; it doesn't tell you if the crowd is right. The best traders use sentiment as one input in a multi-factor decision process.
Watch for Manipulation
Pump-and-dump schemes and coordinated shilling exist on social media. StockHark's bot filtering and duplicate detection help, but stay vigilant:
Dramatic sentiment spikes on low-volume stocks with no news catalyst → red flag
Real sentiment builds gradually with substantive discussion
Artificial hype appears suddenly and lacks depth
S
StockHark TeamResearch
4 min read
ProductTrading
StockHark Beta Launch: Free Sentiment Analysis for Retail Traders
We're excited to announce that StockHark is now live in open beta! After months of development, testing, and refining our AI models, we're ready to put professional-grade sentiment analysis in the hands of retail traders. Everything is free during beta while we gather feedback and validate our algorithms against real market conditions.
What You Can Do Today
Visit StockHark to explore sentiment scores for 4,200+ stocks updated every hour:
Filter by timeframe (2 hours, 6 hours, 24 hours, 48 hours) to see trending stocks
See 7-day price charts for context alongside sentiment data
Track confidence scores to gauge signal reliability
What's Coming Next
Based on early feedback, our roadmap includes highly-requested features:
Custom Alerts: Email notifications when sentiment changes dramatically on your watchlist stocks
API Access: Integrate StockHark sentiment data into your own trading bots or analysis tools
Expanded Sources: Twitter sentiment analysis and financial news integration
Historical Data: Access past sentiment scores to backtest correlation with price movements
Why Beta Matters: Every trader uses the market differently. By offering free beta access, we learn what features matter most, which stocks you track, and how you interpret sentiment scores. Your usage patterns directly influence our algorithm refinements and feature prioritization.
Transition to Paid Model
We'll transition to a subscription model once our AI models and infrastructure are fully proven in live market conditions. Beta users will receive advance notice and special pricing as a thank-you for early feedback. Until then, explore freely and help us build the future of sentiment-driven trading.
S
StockHark TeamProduct
4 min read
DataProduct
Beyond Reddit: StockHark Now Tracks Financial News from Major Outlets
When we launched, Reddit was our only source. That felt right at the time since retail investors were clearly moving markets, and Reddit was where the energy was. But over several months of running the platform, a pattern emerged: Reddit sometimes caught a story hours after financial news had already reported on it. We were leaving signals on the table.
So we built a second data pipeline. StockHark now ingests financial news through a Finnhub integration that pulls articles from Reuters, Bloomberg, MarketWatch, CNBC, Yahoo Finance, and the Wall Street Journal, among others. Each article goes through the same FinBERT sentiment pipeline as Reddit posts, and the source is stored so you can always see where a signal came from.
Why Financial News Sentiment Is Different
News articles tend to be more measured than Reddit posts. A Reuters piece about an earnings miss is written in factual language, while a Reddit post about the same event might be emotionally charged. FinBERT handles both, but the confidence levels differ. News-sourced sentiment tends to score with higher confidence and carries more reliable signals for fundamental reasons. Reddit-sourced sentiment picks up speculative momentum and community emotion faster.
Having both in a single score gives you a fuller picture. A stock with bullish Reddit sentiment but bearish news coverage is a very different situation than one where both channels agree.
What You See in the Dashboard
In the stock detail view, the "Top Sources" section now breaks down mentions by outlet. You can see whether the signal is coming from r/wallstreetbets excitement, a Reuters article about a product launch, or a mix of the two. The time filter also applies to news sources, so switching to the 2h view shows only the most recent coverage.
Coverage note: Finnhub news is refreshed on every collection cycle alongside Reddit. The source label in the dashboard shows finnhub/Reuters, finnhub/Bloomberg, and so on, so the origin is always transparent.
S
StockHark TeamEngineering
5 min read
AnalyticsCharts
Introducing Sentiment History Charts: Watch How a Stock's Story Unfolds Over Time
Snapshot sentiment is useful. Historical sentiment is where things get interesting.
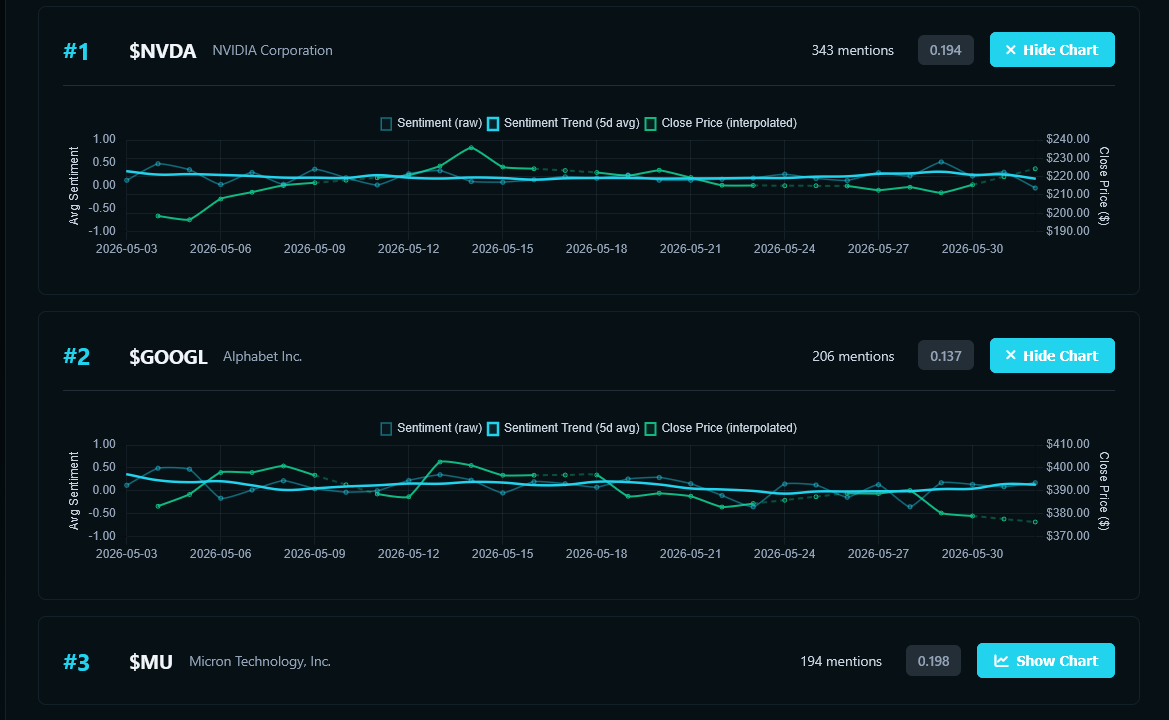
We spent a fair amount of time thinking about how to show seven days of stock data without it becoming a wall of noise. The answer ended up being a three-line chart that layers three separate signals: raw daily sentiment, a five-day moving average, and the actual closing price. Each line tells a different part of the story.
The history chart shows raw daily sentiment (faint purple fill), the 5-day MA trend line, and the closing price overlay. Market-closed days show dashed price segments.
The Three Lines Explained
The raw sentiment line (the faint filled area) shows what Reddit and financial news said about the stock each day without smoothing. It can spike sharply on earnings days or swing negative when bad news hits. Think of it as the unfiltered community reaction.
The trend line is a five-day moving average over the raw sentiment values. It cuts through daily noise and shows whether the overall trajectory is improving, declining, or stable. This is the line to watch for sustained momentum versus one-day events.
The price overlay uses closing price data to put both sentiment lines in context. We draw dashed segments over weekends and market holidays so you know at a glance that gaps in the price line are not data errors. Seeing a sentiment spike happen two days before a price move, or noticing that price and sentiment have been diverging for a week, tells you something that a single score cannot.
How to Read the Chart in Practice
Three patterns tend to repeat and are worth knowing:
Sentiment leads price by one to two days. This happens most often around earnings or product announcements, when Reddit catches wind before the market fully prices it in.
Sentiment and price diverge for a week or more. A sustained positive trend in sentiment alongside a flat or declining price can indicate accumulation. The reverse can flag distribution before a visible drop.
A single-day sentiment spike with no follow-through. The MA trend stays flat even as the raw line jumps. This is often just a viral post or short-lived news event with no lasting impact.
How to open the chart: Click any stock card on the dashboard, then scroll to the History tab inside the detail panel. The chart always shows the last seven days regardless of the time filter you have selected at the top, so you always get the full weekly picture.
S
StockHark TeamProduct
4 min read
ProductTrading
Introducing the Watchlist: A Personal View of the Stocks You Actually Follow
The dashboard's Trends tab is great for discovery. You come in, see what's moving, and find stocks you weren't watching before. But most people also have a short list of tickers they care about every single day. NVDA. TSLA. Maybe a few positions you are already in. Before the watchlist, you had to dig through the leaderboard each time to find them.
The Watchlist tab solves that. It is a dedicated view inside the dashboard that shows your tracked stocks and nothing else, always in the same place, always up to date with the current time filter.
Stock cards in the Watchlist tab look identical to the Trends view so muscle memory carries over. The star icon turns gold on your tracked stocks.
How to Add Stocks
There are two ways. First, you can star any card in the Trends tab and it will appear in your Watchlist immediately. Second, the Watchlist tab has its own search bar at the top that starts matching from the first character you type. Search for AAPL, click the star, and it is in your list before you have even finished typing the ticker.
The search pulls from the same database that the Trends tab uses, so you can add any of the 4,200-plus tracked tickers whether or not they are currently trending. If a stock you follow has not had any Reddit activity in the past 48 hours, its card will show zero mentions rather than disappear entirely, which is useful information in itself.
Live Prices Update Across All Tabs
One thing that tripped up a few beta users: live price tickers update simultaneously across Trends, Watchlist, and search results. You do not need to switch tabs to refresh the prices. The same price injection runs in the background for all three tabs at once, so what you see is always current.
S
StockHark TeamProduct
5 min read
ProductAlerts
Stock Alerts Are Live: Get Notified When Reddit Starts Talking About Your Stocks
This is the feature people asked about most during beta. "Tell me when something is happening so I don't have to check the dashboard every hour." It took longer than we wanted because we were determined to get the signal quality right before we started filling inboxes.
Alerts are now live. Here's how they work.
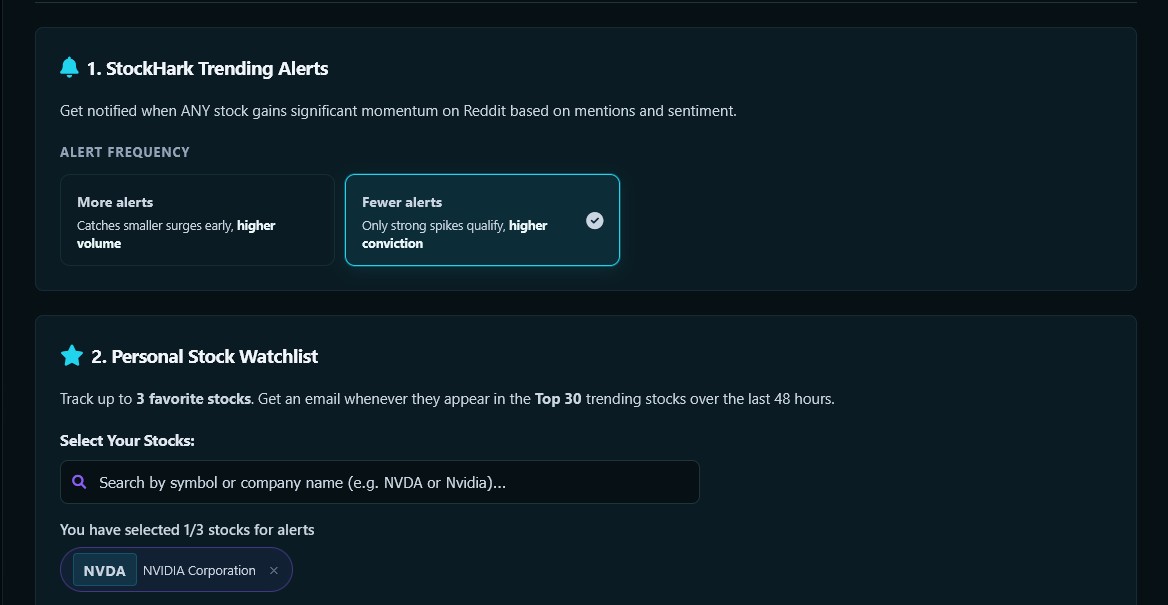
The Alerts page gives you a master toggle, a frequency selector, and up to three personal watchlist tickers. Changes are saved with a single click.
Two Types of Alerts
We built two separate alert channels because trending alerts and personal alerts serve different purposes and you should be able to control them independently.
Trending alerts fire when a stock in the top 30 leaderboard shows a sudden spike in mention velocity. You set the sensitivity: high sensitivity lowers the threshold so you hear about more activity, low sensitivity filters to only the strongest signals. If you turn frequency to "none," trending alerts are off entirely while personal ones still work.
Personal watchlist alerts work differently. You add up to three tickers on the Alerts page. Whenever any of those tickers appear in the top 100 stocks by activity, you get an email. No velocity threshold, no frequency gate. If your stock is getting meaningful attention, you hear about it.
Cooldown Logic Keeps Things Sane
The same stock won't email you every 30 minutes. A 72-hour cooldown per ticker per user prevents alert fatigue. Once an alert fires for a given stock, that ticker is quiet for three days. You can change the cooldown window via the ALERT_COOLDOWN_HOURS environment variable if you're self-hosting. For everyone on stockhark.com, the default is 72 hours and we think that's the right balance for most traders.
To set up alerts: Log in, go to the Alerts page from the nav bar, toggle alerts on, choose your frequency preference, and optionally add up to three tickers to your personal watchlist. That's everything. No forms to fill out, no verification loop.
S
StockHark TeamProduct
4 min read
Data QualityDashboard
Time Filters, Better False-Positive Detection, and a Faster Dashboard
We shipped a batch of quality-of-life improvements in January and none of them were glamorous enough for their own post individually, but together they change how the dashboard feels day-to-day.
Time Filter Tabs That Actually Work
The 2h, 6h, 24h, and 48h tabs have been in the dashboard for a while but they had a subtle problem: the 2h and 6h views were sometimes returning the same list as the 24h view because the short windows were hitting a cache built for the default 48h query. We fixed this by routing short-window requests directly to the source data rather than the aggregation cache. The 2h tab now shows only stocks mentioned in the past two hours, which makes it genuinely useful for spotting very short-term momentum.
Fewer False Positives in the Leaderboard
Common English words that happen to be valid ticker symbols were occasionally showing up in the leaderboard when a high-upvote post used the word naturally. Words like WORK, CAKE, CORN, and RICE were the worst offenders. We updated the validator to require the dollar sign prefix for these ambiguous tickers. So $CAKE in a post still registers as the Cheesecake Factory, but "I had cake for breakfast" no longer contributes sentiment to its score.
We also hard-blocked OP and DC since they appeared constantly in Reddit discussions as abbreviations (Original Poster and Washington DC) and were generating meaningless sentiment for stocks that share those symbols.
Page Title Updates with Your Selection
A small but satisfying change: the dashboard now updates the page title when you switch time filters. "Top 25 Hot Stocks in the last 2h" becomes part of the browser tab, so if you have the dashboard open in multiple tabs with different filters, you can tell them apart at a glance.
S
StockHark TeamEngineering
3 min read
ProductNew Feature
Introducing Market Pulse: The Public Sentiment Leaderboard, No Account Required
Up until today, you needed an account to see any of StockHark's sentiment data. That made sense for the dashboard since it is a full-featured tool with alerts, watchlists, and personal history. But it created a problem for people who just wanted to see what was trending without committing to a signup flow.
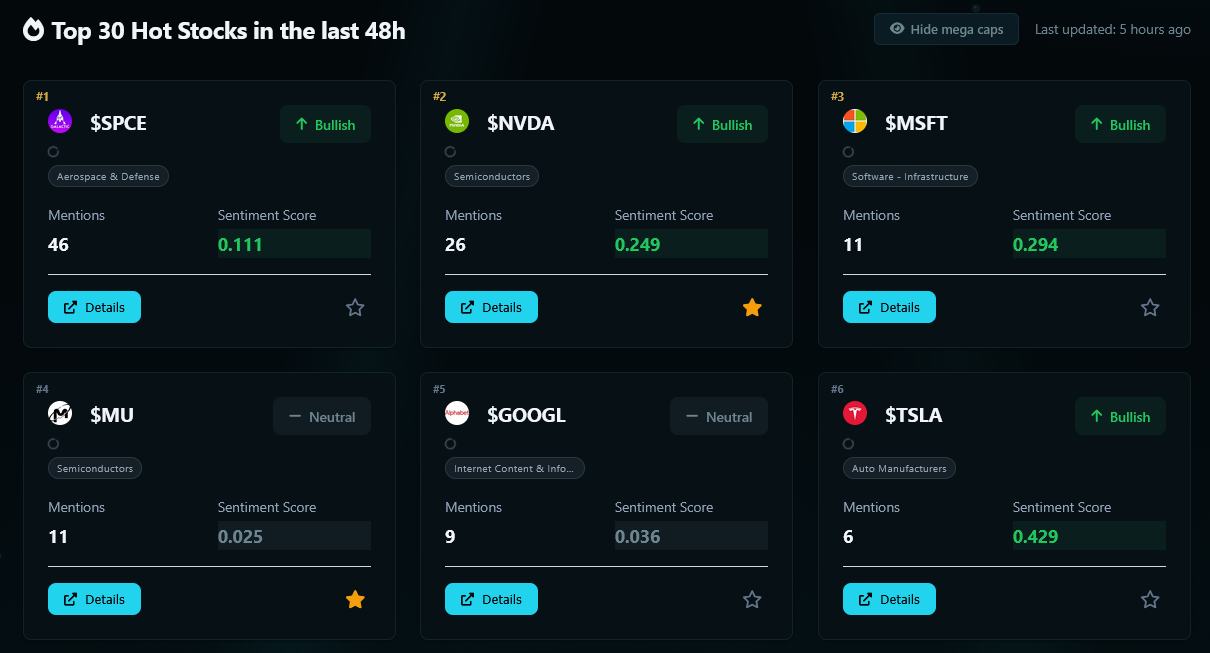
Market Pulse is our answer to that. It is a public page at stockhark.com/market-pulse that shows the sentiment leaderboard for the current day, refreshed every 30 to 60 minutes, with no login required. Ranks 6 through 30 are visible to everyone. Ranks 1 through 5 are reserved for account holders since those top positions are where the strongest signals tend to cluster.
The Market Pulse leaderboard shows each stock's sentiment score, signal label, mention count, and a bullish/bearish/neutral breakdown bar at a glance.
Archive Pages Going Back 90 Days
Every day gets its own permanent page. /market-pulse/2026-03-22 will always show you what was trending on March 22. These archive pages are useful for reviewing what the community was excited or concerned about on a specific date, especially if you want to cross-reference sentiment history against price movements you remember from that period.
From the live page, a quick-access strip at the bottom links to the past seven days so you can jump between dates without typing URLs. On archive pages, prev and next buttons let you step through the history one day at a time.
What Logged-In Users See
If you have an account and you are logged in, Market Pulse shows the complete top 30 with ranks starting at 1. The signup teaser disappears and the page just becomes a clean, fast read on today's sentiment landscape. Think of it as a leaner version of the dashboard for a quick morning check rather than a full session.
Bookmark it:stockhark.com/market-pulse is the fastest way to check what is trending on Reddit today without opening the full dashboard.
S
StockHark TeamProduct
See it in action
Track real-time stock sentiment from Reddit and financial news. Free beta access available now.
StockHark uses only essential cookies needed for login and security.
No tracking, no advertising, no analytics cookies.
Privacy Policy
Refreshing stock data...
Important Disclaimer
Please read before using StockHark
×
StockHark is not a financial advisor. All data, sentiment scores, and analysis on this platform are provided for informational and research purposes only.
No investment advice: Nothing on this site is a recommendation to buy, sell, or hold any security.
Data accuracy: Data may be delayed, incomplete, or contain errors. Always verify with primary sources before acting.
Risk awareness: Trading and investing involve significant risk. Past sentiment is not indicative of future results.
Our recommendation: Consult a licensed financial advisor before making any investment decisions that affect your financial well-being.
By continuing to use StockHark you confirm you understand this is an informational tool only and you are solely responsible for your financial decisions.
Get in Touch
We would love to hear from you
×
For support, feedback, or general inquiries, reach out to us directly: